Where Did 24,524 Votes Come From?
September 08, 2026
Updated September 9, 2026 with the official results from the Secretary of the Commonwealth, which changed the totals slightly and extended the precinct-level analysis to all 35 towns.1
Our campaign released this statement following the Sept 1 Democratic primary:
While the results of the primary election were far from the progressive change our campaign had hoped for, over 24,000 voters in MA-4 voted for a platform of Medicare-for-All, dismantling our corrupt campaign finance system, and ending forever wars.
We were outspent 20:1 in the last two weeks of the campaign by an outside crypto super PAC that coordinated with the incumbent’s campaign. The incumbent’s campaign was forced to run polls and spend on digital advertising for the first time since 2020.
More importantly, we forced the incumbent to the left: co-sponsoring the Citizens over Corporations Amendment to overturn Citizens United 16 months into the congressional session, voting against military funding for Israel for the first time, and rhetorically matching the position of abolishing ICE. He would not have conceded to these popular positions if not for our campaign.
I’m proud that we ran a credible campaign with a dedicated “small army of volunteers” — no paid staff, no campaign consultants. We demonstrated that this self-organizing model of volunteers can be viable, and can be improved in future iterations.
We will continue to fight because we are true believers.
Who voted for us? To find out, we joined the precinct and town results to our voter file, our canvassing and text-banking logs, and Census data.2
The result
We received 24,524 votes out of 95,770 ballots cast across all 35 towns in the district. That is 25.6 percent of all ballots. Counting only ballots cast for one of the two candidates, and setting aside blanks, it is 26.8 percent.3
Turnout was 1.32 times the uncontested 2024 primary in the same towns, 95,770 ballots against 72,676, an increase of 32 percent.2
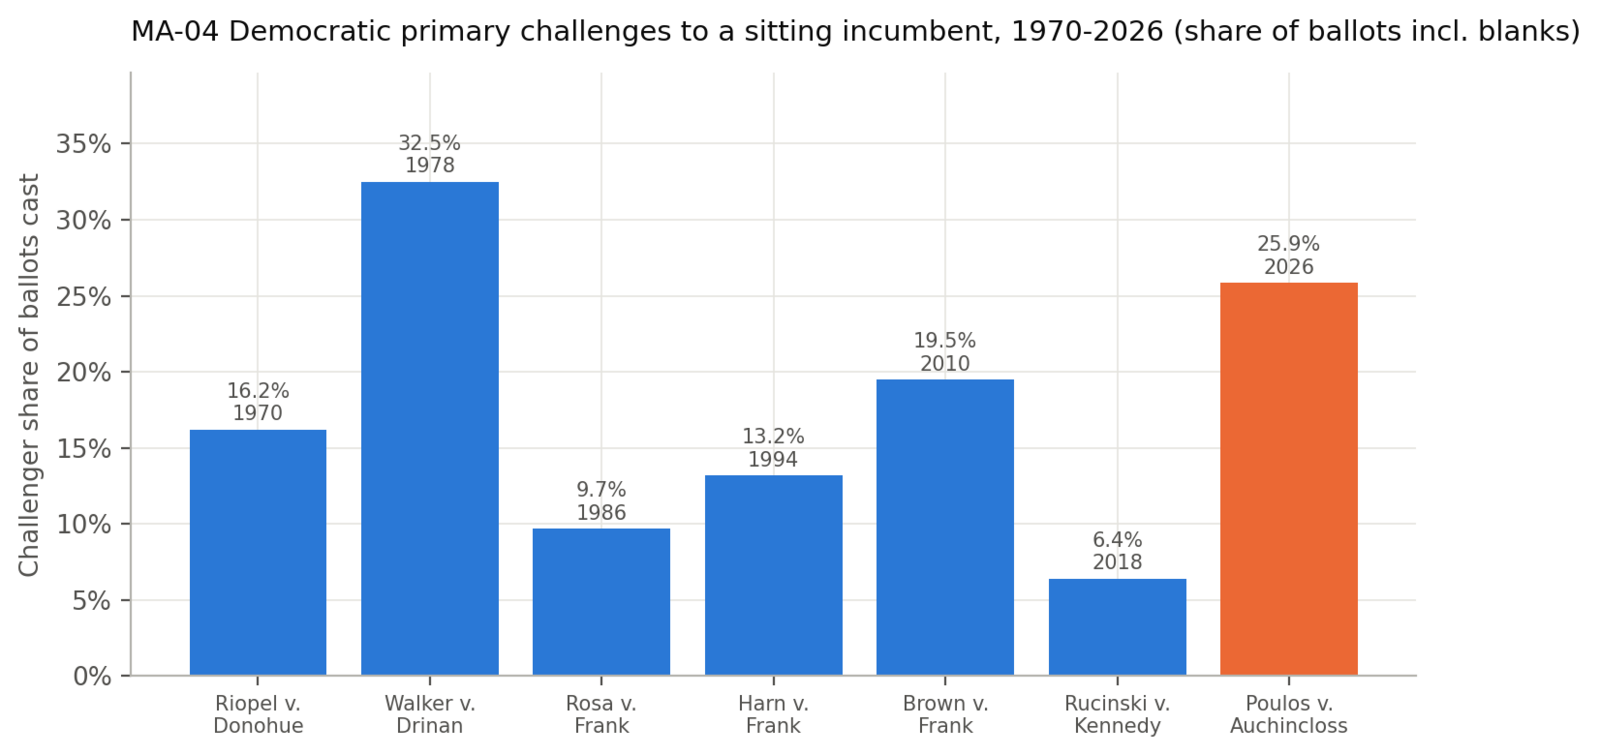
Figure 1 puts 25.6 percent in context. We pulled every MA-04 Democratic primary since 1970 from the Secretary of the Commonwealth’s election statistics. In 19 of the last 28 cycles the sitting congressman had no primary opponent at all. Of the seven times someone did challenge the incumbent, only one did better than we did: Norman Walker, who took 32.5 percent of ballots against Robert Drinan in 1978. Every challenge since then fell well short of ours.4 Our result is therefore the strongest showing by a primary challenger to a sitting MA-04 congressman since Walker in 1978, and the highest in the 48 years since. It is also worth remembering that the incumbent was unopposed in both 2022 and 2024, so the last time voters in this district had a choice in a Democratic primary for this seat was the open race in 2020.
Where the votes came from
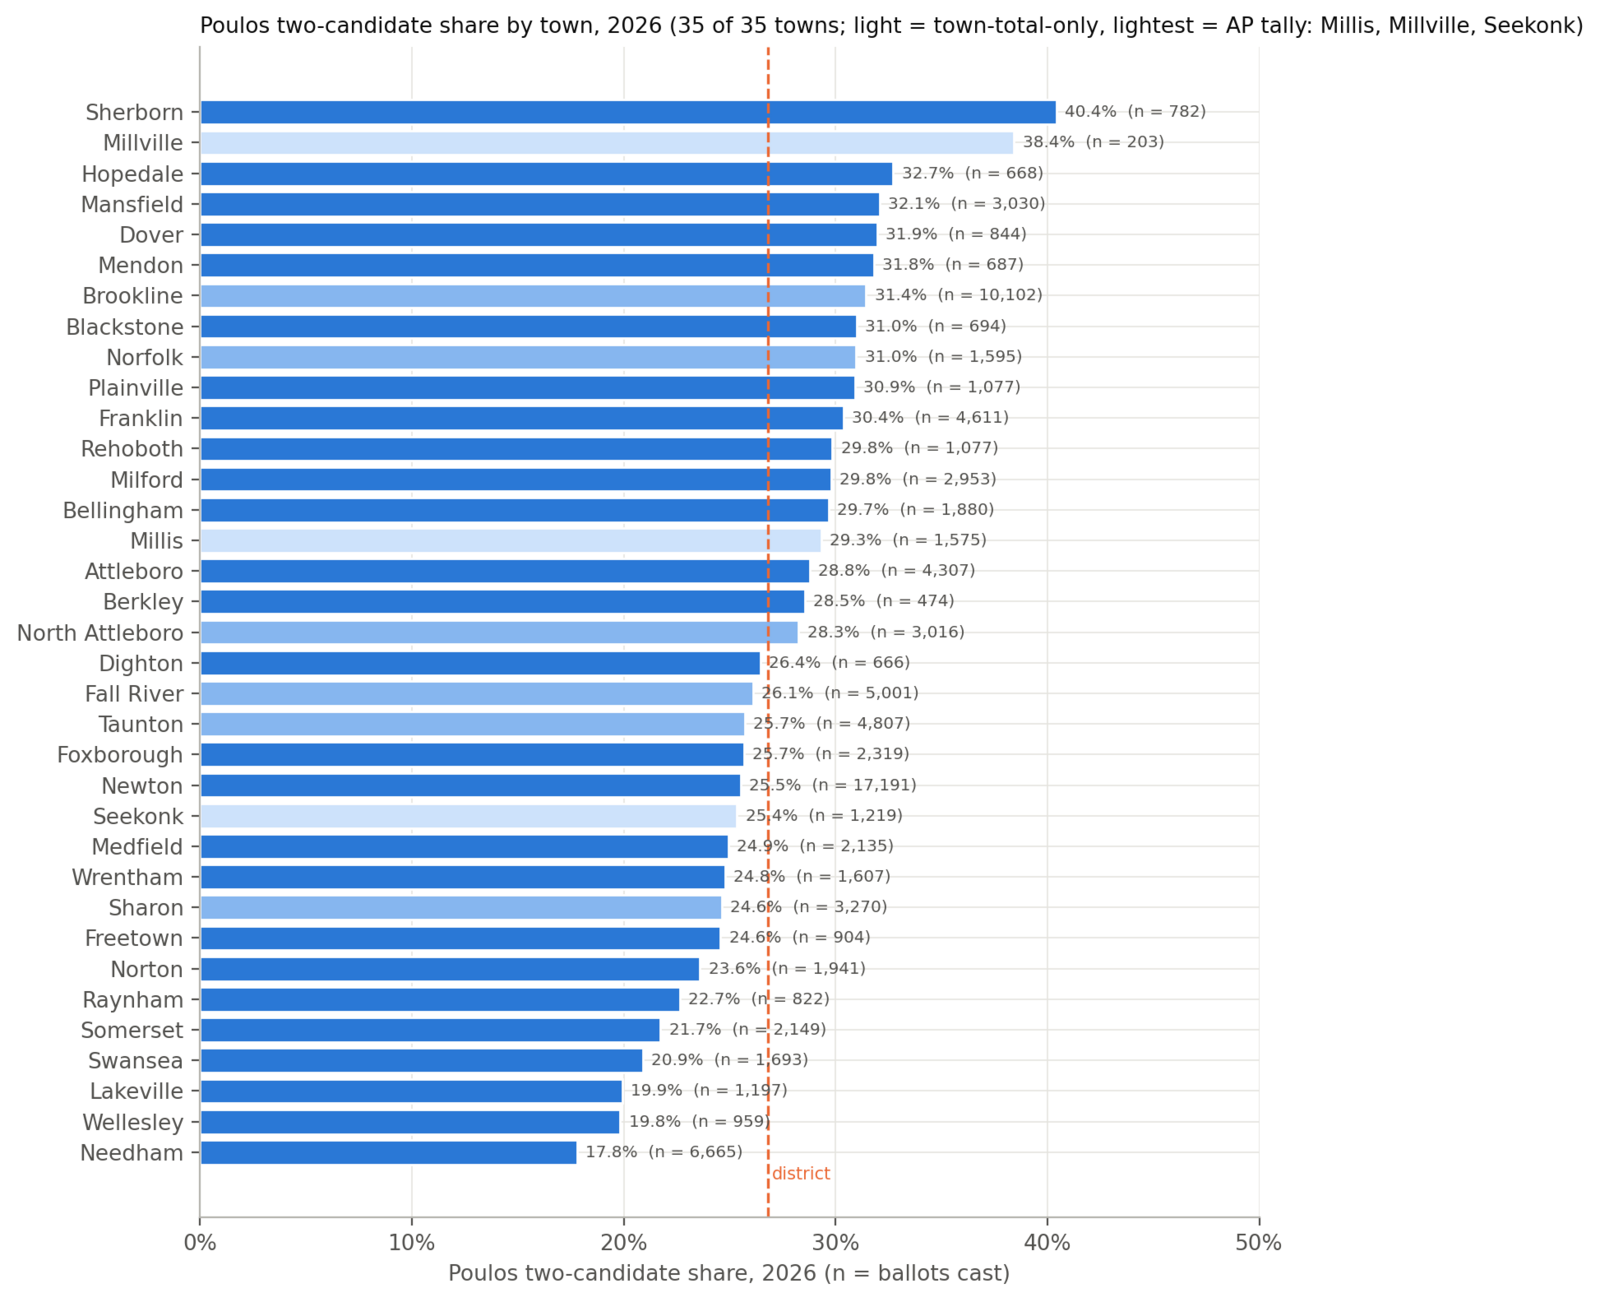
As Figure 2 shows, our vote was spread across the district rather than concentrated in a few strongholds. Half of our votes came from precincts holding 41 percent of all ballots, which is close to what an even spread would give. The best town was Sherborn at 40.2 percent, followed by Millville at 38.4 percent on only 210 ballots, then Hopedale at 32.7, Mansfield at 32.0, Dover at 31.9, Mendon at 31.8, Brookline at 31.4 and Blackstone at 31.1. The weakest towns were Needham at 17.8 percent, Wellesley at 19.8, Lakeville at 19.9, Swansea at 20.9 and Somerset at 21.7. Among precincts of ordinary size, our share ran from about 12.5 percent in a Newton Ward 8 precinct to 40.2 percent in Sherborn. The extremes beyond that, a 22-ballot Newton precinct at 9.5 percent, a 77-ballot Fall River precinct at 44 percent and a 6-ballot Taunton precinct where four of the six votes were ours, are too small to read anything into. Taunton itself, at 25.7 percent, ranked 21st of the 35 towns, just under the district share, and its full-size precincts ran from about 21 to 33 percent. Newton, the largest town with 17,442 ballots, came in at 25.6 percent, but that average hides almost the entire district range: its precincts run from the weakest in the district to some of the strongest at about 39 percent.
Who voted for us
We do not know how any individual voted. What we can see is how a precinct’s result relates to the characteristics of the people registered there. It describes places, not people.5 With that said, the pattern in Figure 3 is strong and consistent. The same precinct characteristics line up with our share across the whole district, not just in one or two towns: they sort the precincts inside Newton, which on its own spans almost the entire district range, the same way they sort precincts across the 35 towns. The direction of each relationship is the same whether precincts are weighted by ballots cast or counted equally, apart from what a handful of precincts with a few dozen ballots do to the unweighted numbers. And of everything we measured, the characteristic that lines up most closely with our share is the age of the electorate.
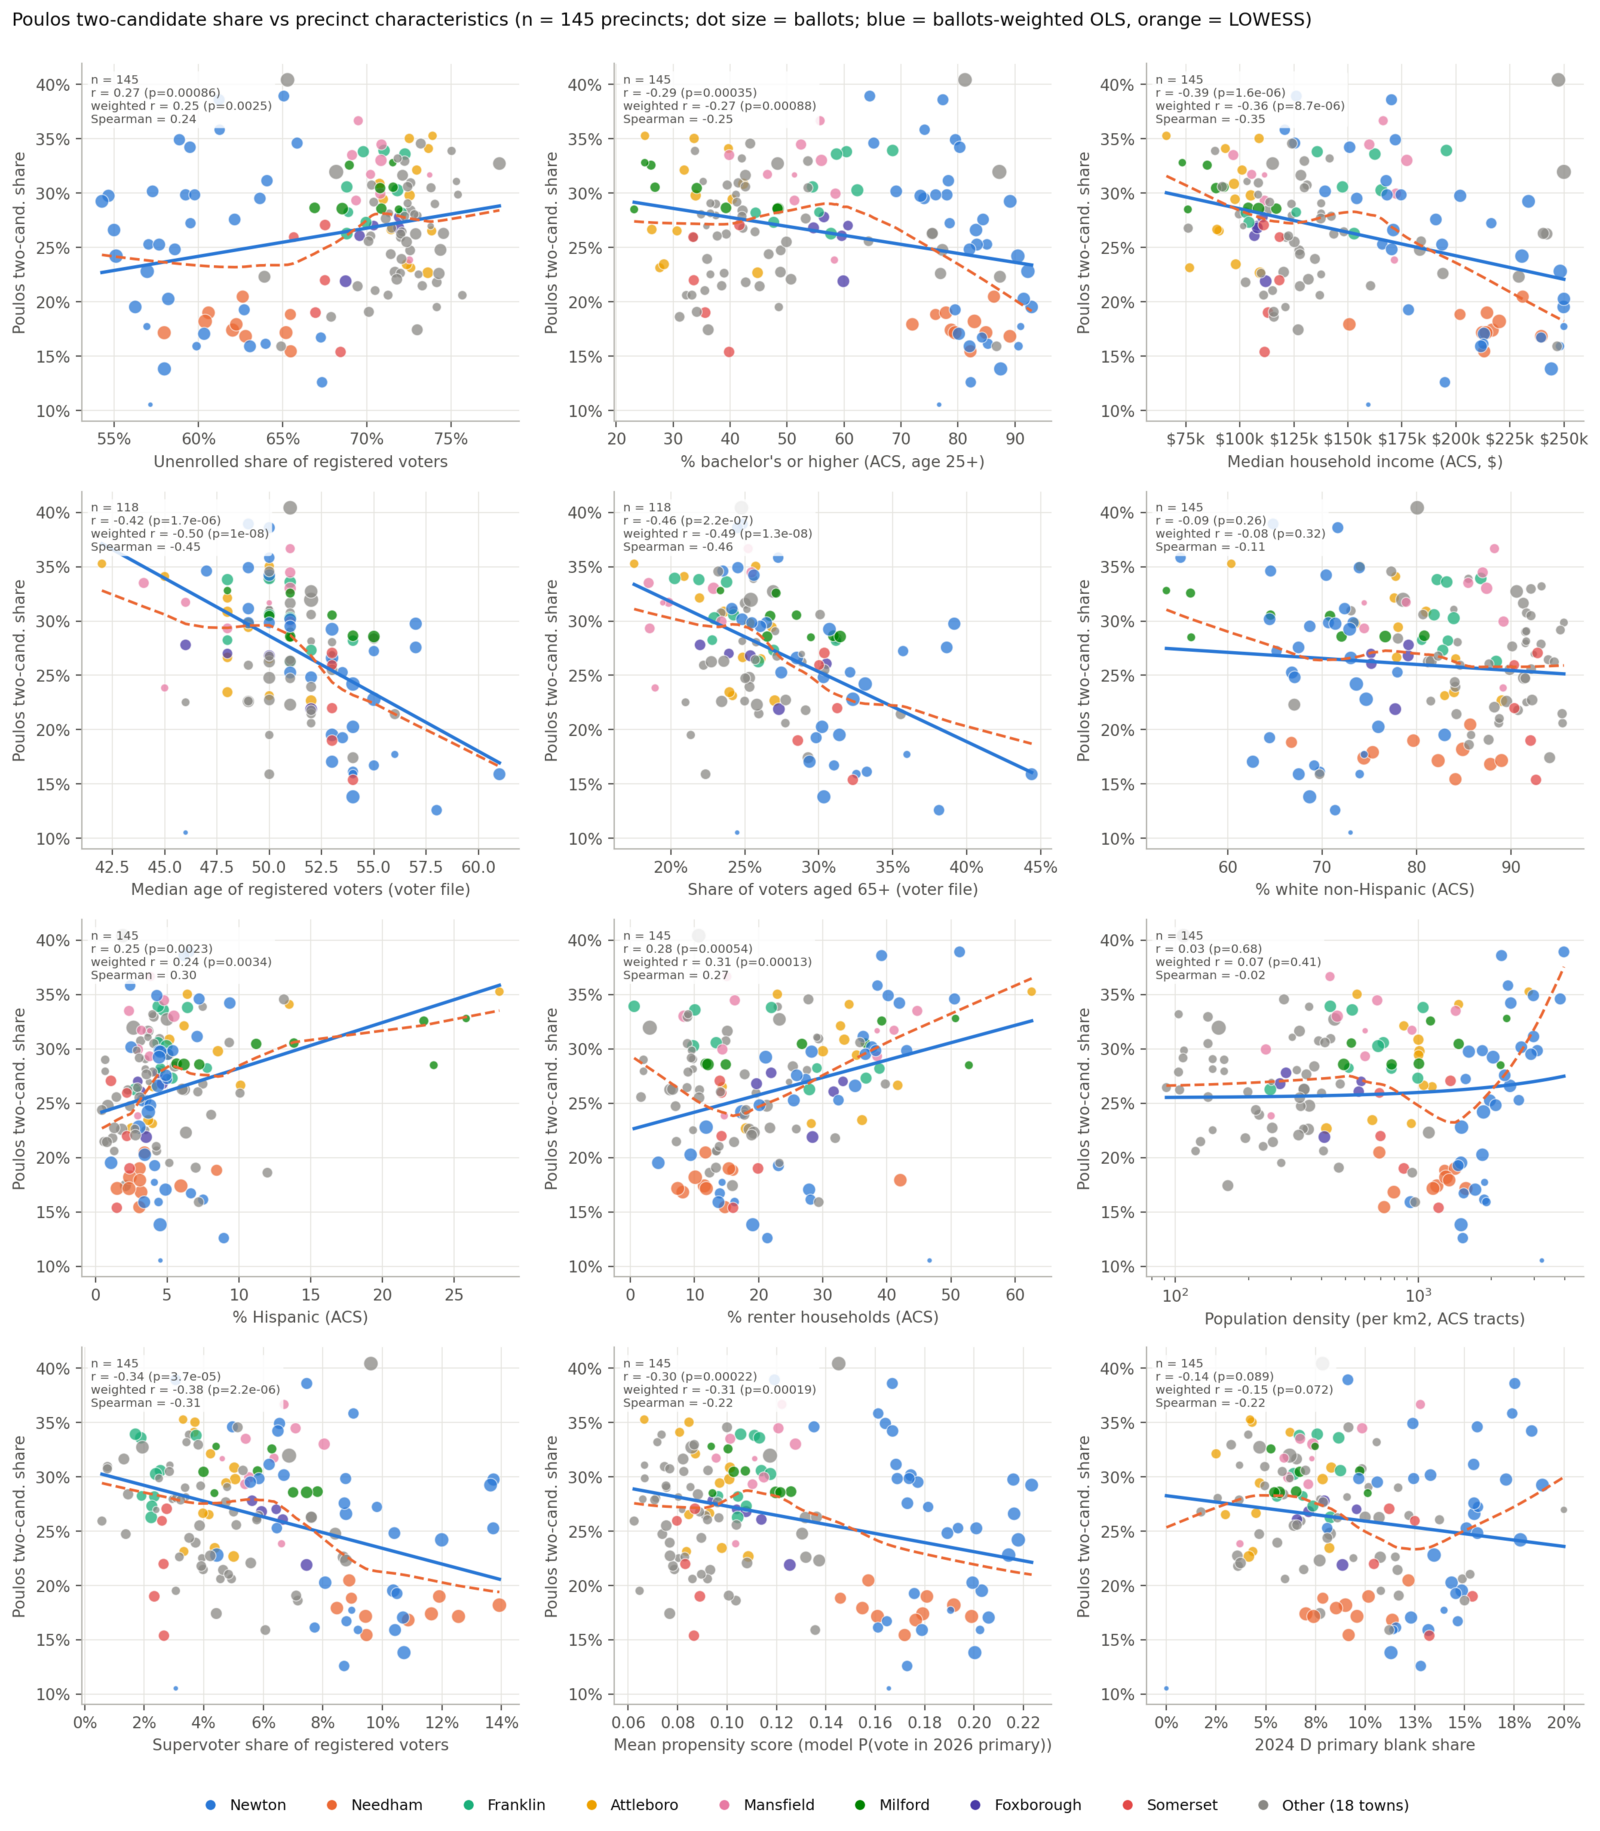
Age is the strongest correlate of our vote. The correlations below weight each precinct by ballots cast, so that a handful of precincts with only a few dozen ballots do not swing the result. Across the 199 precincts where the voter file records dates of birth, our share fell as the median age of registered voters rose, with a correlation of -0.47, and fell as the share of voters aged 65 and over rose, with a correlation of -0.40. A correlation runs from -1 to +1, and these are the largest in the whole analysis. In a model that accounts for income, education, party mix and other factors at the same time, age is the only characteristic that stays significant, and it does so in every sample we tried: each additional year of median voter age in a precinct was worth about 0.9 percentage points less for us, and the range of plausible values, the confidence interval, runs from about half a point to 1.3 points.
Our share was lower where household incomes were higher, with a correlation of -0.30, and where our own turnout model scored the electorate as most likely to vote, at -0.22. It was higher where more households rent, at +0.36, where people live more densely, at +0.33, and where more residents are Hispanic, at +0.17. Three patterns that looked solid on election night did not survive the official precinct data. In the 26 towns that posted precinct results on election night, our share was higher where more voters were unenrolled rather than registered Democrats, and lower where more voters were supervoters who vote in every primary or held graduate degrees, with correlations of about +0.25, -0.38 and -0.33, and those numbers hold on the same precincts with the official counts. But Brookline, which is Democratic-enrolled, supervoter-heavy and highly educated, gave us 31 percent, and Fall River, which is unenrolled, low-propensity and has few degrees, gave us 26 percent, and once their precincts enter the picture the district-wide correlations fall to 0.00, -0.09 and -0.12, too weak to call findings. Younger, denser, more renter-heavy precincts were more favorable to our campaign. Older, wealthier, highest-propensity precincts, which describes Needham, Wellesley and much of Newton, were more favorable to the incumbent.
Election day beat early voting
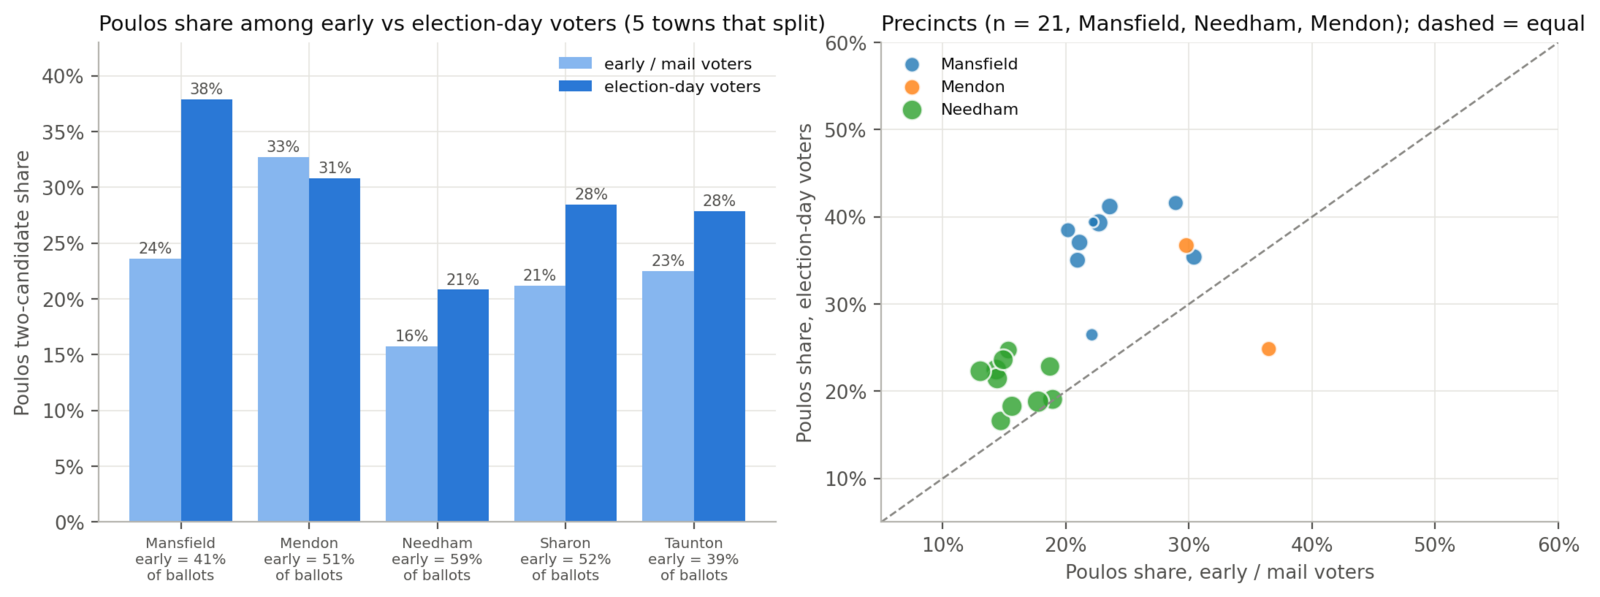
Figure 4 covers the five towns, Mansfield, Mendon, Needham, Sharon and Taunton, that report early and mail ballots separately from election-day ballots, 18,459 attributed ballots in all. Among early and mail voters in those towns we won 19.9 percent of the two-candidate vote. Among people who voted on election day we won 28.0 percent. Our share of the vote was higher among election-day voters than among early and mail voters, by 8.1 points across the five towns. Our election-day share was higher in four of the five towns: by 14.2 points in Mansfield, 7.3 in Sharon, 5.3 in Taunton and 5.1 in Needham, with Mendon the one exception at -1.9. In the 39 precincts of Mansfield, Mendon, Needham and Taunton that report the split, our election-day share was higher than our early share in 34 and lower in only three. The other two, both tiny Taunton precincts, cast no early ballots at all. Election-day voters were more favorable to us than early and mail voters, whose ballots leaned more heavily to the incumbent.
Precincts whose ballot count grew the most over 2024 gave us a higher share, with a correlation of +0.20 at precinct level, +0.32 when precincts are weighted by ballots, and +0.44 at town level, while precincts with the highest overall turnout gave us less: turnout growth predicted our share, and new primary voters were our voters. The Bristol County cities where turnout fell or barely moved, Swansea at 0.95 times its 2024 count, Fall River at 1.00, Somerset at 1.02 and Taunton at 1.16, were all below-average towns for us, while Hopedale at 1.74 and Mendon at 1.63 were among our best.
What canvassing did
Volunteers knocked about 33,000 doors in 31 of the district’s 35 municipalities, from the first canvass in late April through election day on September 1. The effort was concentrated in a handful of towns: Newton and Brookline together accounted for nearly half of all knocks, followed at some distance by Fall River, Attleboro and Needham. Most knocks found nobody home, and most of the field work came in August.
Figure 5 measures the 2026 change against three earlier races. The 2022 and 2024 primaries had no challenger, so the share of voters who left the line blank or wrote someone in is the closest available pre-campaign measure of resistance to the incumbent in each precinct, and the share that voted for someone other than the incumbent in the 2024 general election serves the same purpose. Estimating the canvassing effect against each of them, and against the raw 2026 level, checks that the result does not depend on which baseline is chosen.
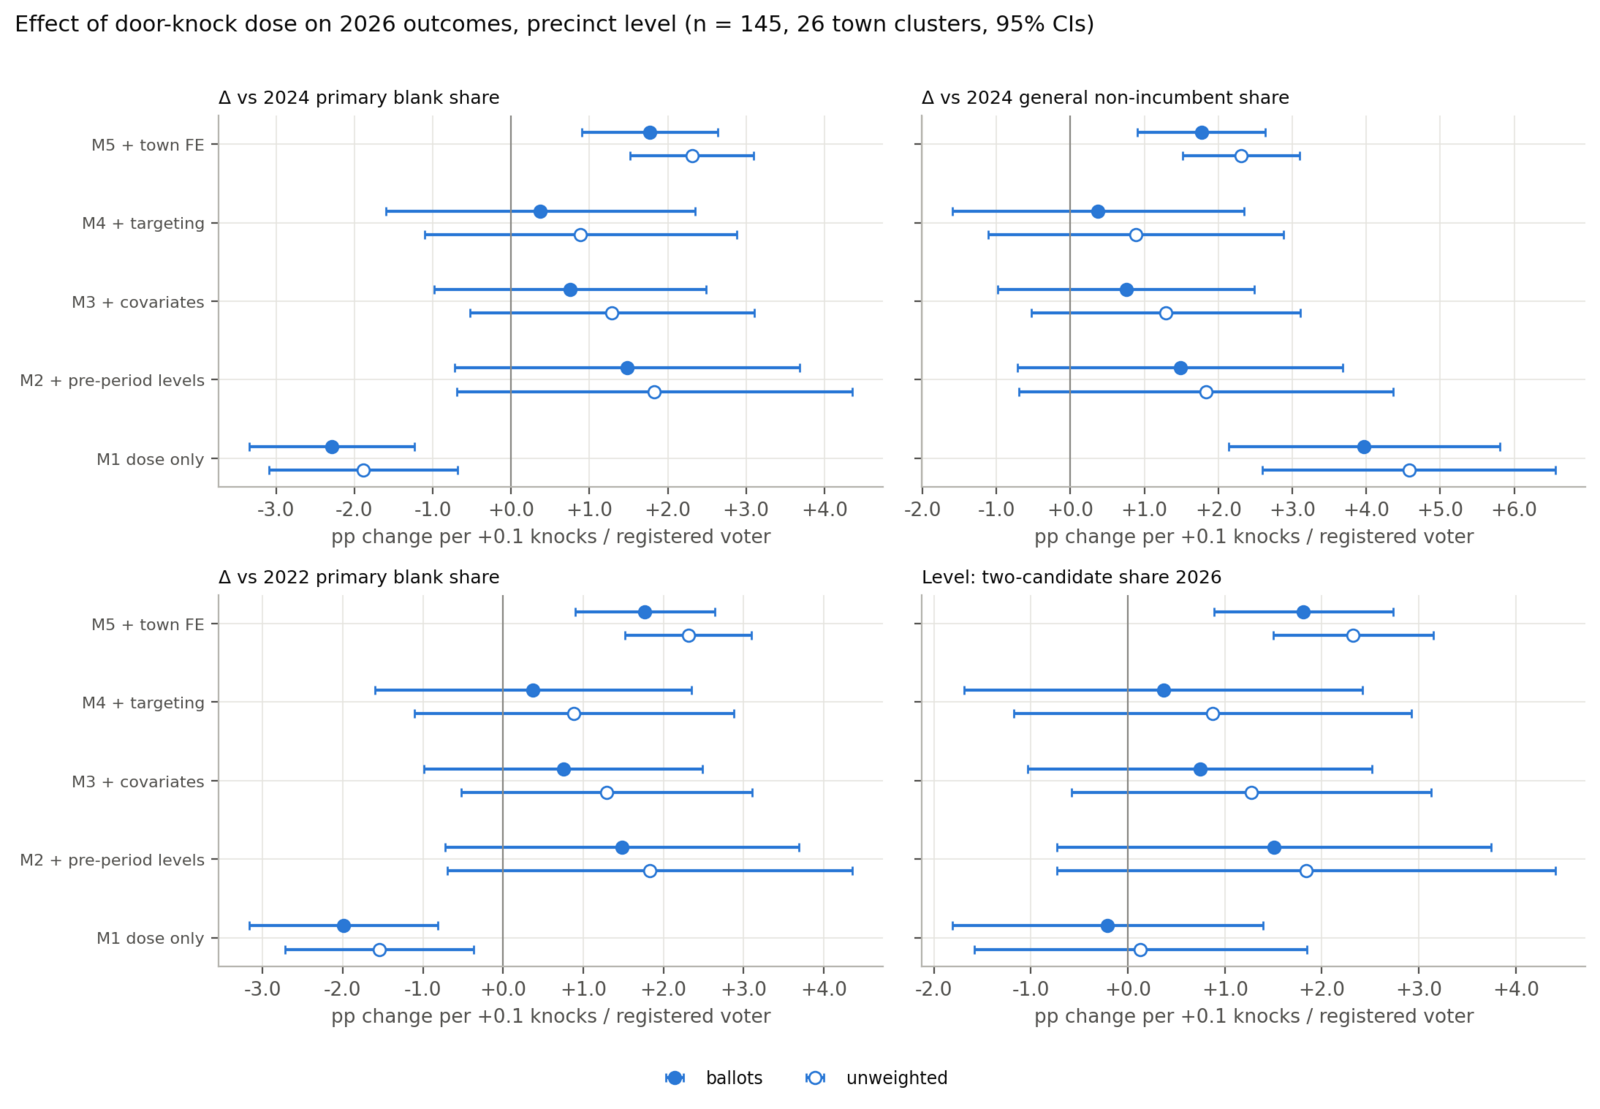
Figure 5 relates each precinct’s swing against its 2024 baseline to how heavily it was canvassed, in five models. M1 uses the knock rate alone. M2 adds the precinct’s earlier results: the 2022 and 2024 primary blank shares and the 2024 general non-incumbent share. M3 adds unenrolled share, education, income, age, white share and population density. M4 adds our own targeting: households with a target voter or a supervoter, mean propensity score, routes touching the precinct and canvass events in the town. M5 adds town fixed effects, comparing each precinct only with others in the same town. Only M5 is clearly distinguishable from zero: 1.6 percentage points per 0.1 knocks per registered voter, interval 0.8 to 2.4. M1 is negative, -0.9 points, interval -3.1 to +1.2, because canvassing went where the 2024 blank share was already high, and those precincts drifted back toward the mean. M2 through M4 are positive but imprecise: M2 gives 1.6 points, interval 0.1 to 3.2, and M4, with the full set of controls, 1.4 points, interval -0.6 to +3.4. In votes, that is about 1,000 on M4, 1,100 on M5 and 1,900 with the two heavily canvassed Wellesley precincts dropped, while a reach-based ceiling, fifteen answered doors per hundred knocks and one vote per ten conversations, gives a few hundred. So canvassing was worth somewhere between a few hundred and about 1,900 of our 24,524 votes.6 The within-town estimates partly reflect where routes were sent, not only what the knocking did.
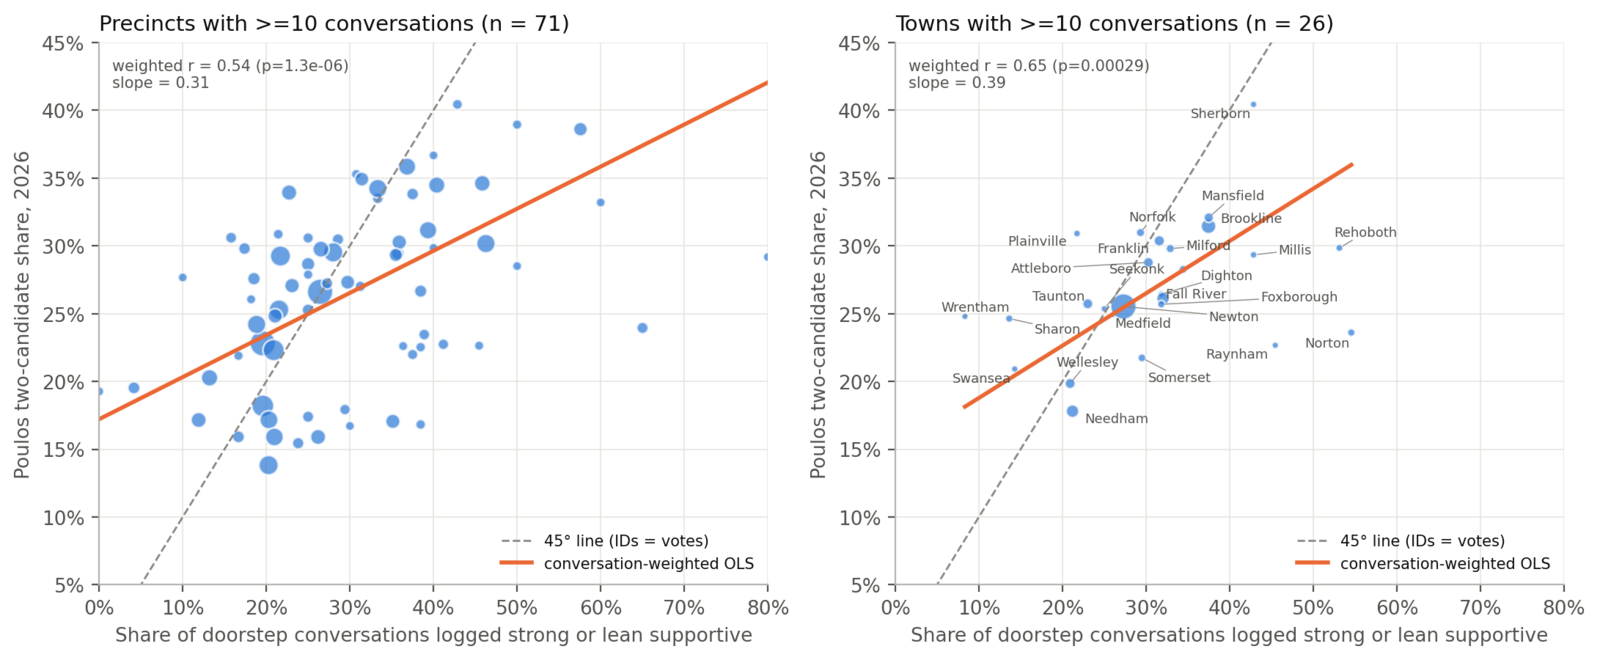
Figure 6 shows that among the 105 precincts with at least ten conversations, the share of conversations logged as supportive correlated 0.51 with our actual share. The IDs ranked precincts well but overstated the level, with a slope of 0.28: a precinct where 40 percent of conversations were supportive typically delivered about 30 percent.
What texting did

The text program, charted alongside the door program in Figure 7, was enormous for a campaign with no staff. Volunteers texted 184,646 voters, 31.5 percent of everyone registered in the district, and nearly all of that volume, like the door knocking, came from mid-July on.
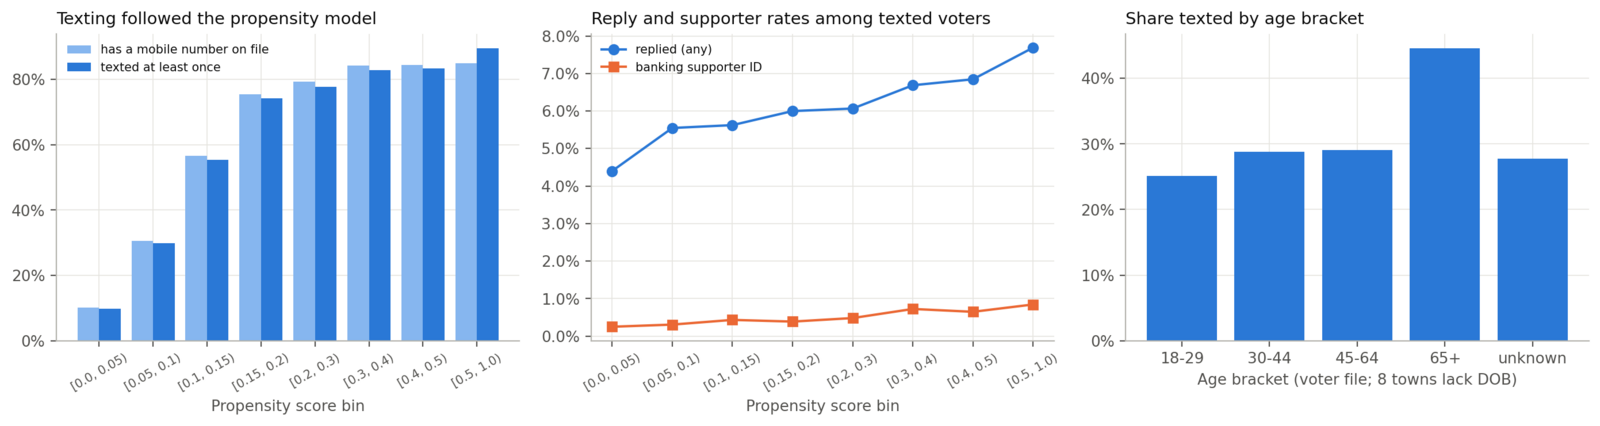
To measure an effect you need a comparison group of similar voters who were not contacted. We texted 98.6 percent of every voter for whom we had a mobile number, so texting had no comparison group. As Figure 8 shows, the mobile numbers themselves were purchased for the voters our turnout model scored highest, and that model was built on habitual primary voters, a group that leaned toward the incumbent in these results. The texted voters had a mean propensity score of 0.23 against 0.11 for the district, and supervoters were 15 percent of them against 6 percent of everyone. In other words, the phone list pointed at the part of the electorate that leaned toward the incumbent. The one measure with any independent variation, the share of high-propensity voters in a precinct who were texted, shows about zero within towns: +0.1 points per standard deviation, with an interval from -0.9 to +1.1.
What we would do differently
The first lesson is to target the electorate that actually moved. Our voters were younger, more often renters, in denser precincts whose turnout grew over 2024, and our share was higher among election-day voters than among early and mail voters. Our turnout model, and therefore our phone list and text program, was built around habitual primary voters, a group that leaned toward the incumbent. The early-vote gap also argues for a real election-day turnout program.
The second is to canvass where the swing was rather than where the volunteers lived. The most heavily canvassed third of precincts was dominated by Newton and Brookline, with Fall River, Attleboro, Needham, Taunton and Wellesley behind them: taken together, the precincts with the highest education, income and propensity in the district, which is the profile that leaned most toward the incumbent. Millville, Hopedale, Mansfield, Dover, Mendon, Blackstone, Norfolk and Plainville, all at 30 percent or better, received between zero and 931 knocks each. Newton itself was not uniform: in our precinct data Ward 1, which includes Nonantum, was our best ward at about 34 percent of the two-candidate vote, with Ward 4 next, while Wards 7 and 8 were under 20 percent. The Newton Beacon found the same pattern at the village level, with historically working-class Nonantum our best village and Oak Hill, in Ward 8, the incumbent’s strongest.
The third is to start earlier and to get more conversations out of each door knocked. The field program only reached scale in August, and most knocks found nobody home. A longer runway would allow a second pass at the doors where nobody answered, and time to follow up before election day with the households already identified as supportive. The early-vote gap argues for pairing the door program with an election-day turnout effort.
The key takeaways, each one drawn from the numbers above:
- We won 24,524 votes, 25.6 percent of all ballots across all 35 towns, the strongest primary challenge to a sitting MA-04 congressman in 48 years.
- Age was the strongest correlate of our vote, and each additional year of median voter age in a precinct cost us about 0.9 points.
- Our election-day vote share was higher than our early-vote share by 8.1 points in the five towns that split the count.
- Turnout growth predicted our share, with correlations of +0.20 at precinct level and +0.44 at town level, so new primary voters were our voters.
- Canvassing was worth a few hundred to about 1,900 votes, and the larger figures partly reflect that volunteers were sent to precincts we already expected to be friendly.
A note on methods
The full analysis exists as code, tables and figures: 236 precincts in all 35 towns, joined to the voter file, the canvassing and text-banking logs, and American Community Survey tract data. Regressions are weighted by ballots cast, with standard errors clustered by town, 35 clusters. All 2026 results are the official returns certified by the Secretary of the Commonwealth. The historical table, with links to every source election on electionstats, is here. If you want the underlying tables or code, write to us.
Notes
-
The September 8 version of this post used election-night tallies from town clerks and, for three towns, Associated Press counts. Certification added 1,650 ballots district-wide, most of them blank ballots that the election-night sheets in six towns did not count, and moved the candidate totals by +445 for the incumbent and +190 for us; 18 of the 35 towns were identical. The two-candidate share is unchanged at 26.8 percent, and the share of all ballots moved from 25.9 to 25.6 percent only because the newly reported blanks enter the denominator. The larger change is the sample. The official file added precinct results for 73 precincts in eight towns, including Brookline and Fall River, which had only town totals on election night, so the precinct-level analysis now covers 236 precincts in all 35 towns rather than 145 in 26. A second revision on September 9 joined Taunton’s 18 precincts, which the first revision had carried as a town total, after a mislabeled column in the city’s voter file was corrected; it changed no conclusion. Re-running every estimate on the original 145 precincts with the official counts reproduces the September 8 figures almost exactly, so the added precincts, not the revised counts, are what moved the canvassing estimates and what removed the unenrolled, supervoter and graduate-degree correlations from the findings. ↩
-
The 2026 results are the official returns published by the Secretary of the Commonwealth, electionstats election 173039, for every town and precinct. The split between early and mail ballots and election-day ballots comes from the town clerks’ election-night sheets for the five towns that published it, attached to the official totals. Where a sheet fell short of the certified total the remainder is unattributed, 23 ballots in Mansfield, 32 in Sharon and 1 in Mendon, and the early and election-day shares are computed on attributed ballots. ↩ ↩2
-
This post uses share of all ballots for the district-wide result and for the historical comparison. For town and precinct comparisons it uses the two-candidate share, which sets aside blanks and write-ins and measures the choice between the two candidates directly. On election night several towns, including Brookline and Fall River, reported no blank count, so the two-candidate share was the only basis on which every town could be compared; the official returns report blanks everywhere, and we have kept the same basis so the comparisons stay consistent. ↩
-
The best of them was Rachel Brown’s 19.5 percent against Barney Frank in 2010. ↩
-
Statisticians call this an ecological analysis: it relates the result in a place to the characteristics of the people registered there, and it cannot say how any group of individuals voted. Precinct characteristics come from our voter file and from the U.S. Census Bureau’s American Community Survey, 2023 five-year tract estimates weighted to each precinct by household count. Correlations and regressions are weighted by ballots cast, with standard errors clustered by town, 35 clusters. The correlations quoted in this section, like the fitted lines in Figure 3, leave out the three precincts with fewer than 30 ballots cast, 233 precincts rather than 236; including them changes none of the ballots-weighted correlations by more than 0.01. ↩
-
One in ten is a generous assumption. Randomized field experiments find that door-to-door canvassing reliably raises turnout, but that its effect on which candidate a voter chooses averages about zero in general elections. In primaries, persuasion is possible, and one vote per ten conversations is at the high end of what those studies have measured. On turnout: Donald P. Green and Alan S. Gerber, Get Out the Vote: How to Increase Voter Turnout, 5th ed. (Washington, DC: Brookings Institution Press, 2023), https://www.brookings.edu/books/get-out-the-vote-2/, which summarizes decades of randomized field experiments and finds that door-to-door canvassing raises turnout more reliably than any other tactic, provided canvassers actually reach voters at home. On persuasion: Joshua L. Kalla and David E. Broockman, “The Minimal Persuasive Effects of Campaign Contact in General Elections: Evidence from 49 Field Experiments,” American Political Science Review 112, no. 1 (2018): 148-166, https://doi.org/10.1017/S0003055417000363, find that the best estimate of the effect of campaign contact on candidate choice in general elections is zero. Their meta-analysis of primary elections, where there is no party label, finds an average effect of about 4.5 percentage points among voters contacted, with a confidence interval that includes zero, and their own canvass in a competitive 2015 mayoral primary moved support by about 11 points when measured a week after the conversation and six weeks before the election. That canvassing can persuade at all is shown by David E. Broockman and Joshua L. Kalla, “Durably Reducing Transphobia: A Field Experiment on Door-to-Door Canvassing,” Science 352, no. 6282 (2016): 220-224, https://doi.org/10.1126/science.aad9713, in which a single ten-minute conversation shifted attitudes for at least three months. These are effects per voter contacted, so one vote per ten conversations sits at the high end of what the primary studies have found. ↩